 Search
404 page on a three-language site: which language to show and where to send visitors
Which language to show on a 404 page, where to send visitors, and how real 404s differ from soft 404s. Our robot page and the Not found (404) report.
Cookies on this site
The site stores what it needs itself: your theme, your animation setting and this choice. Analytics, marketing and external services switch on only with your consent. You can change your mind at any time. More about cookies
Search
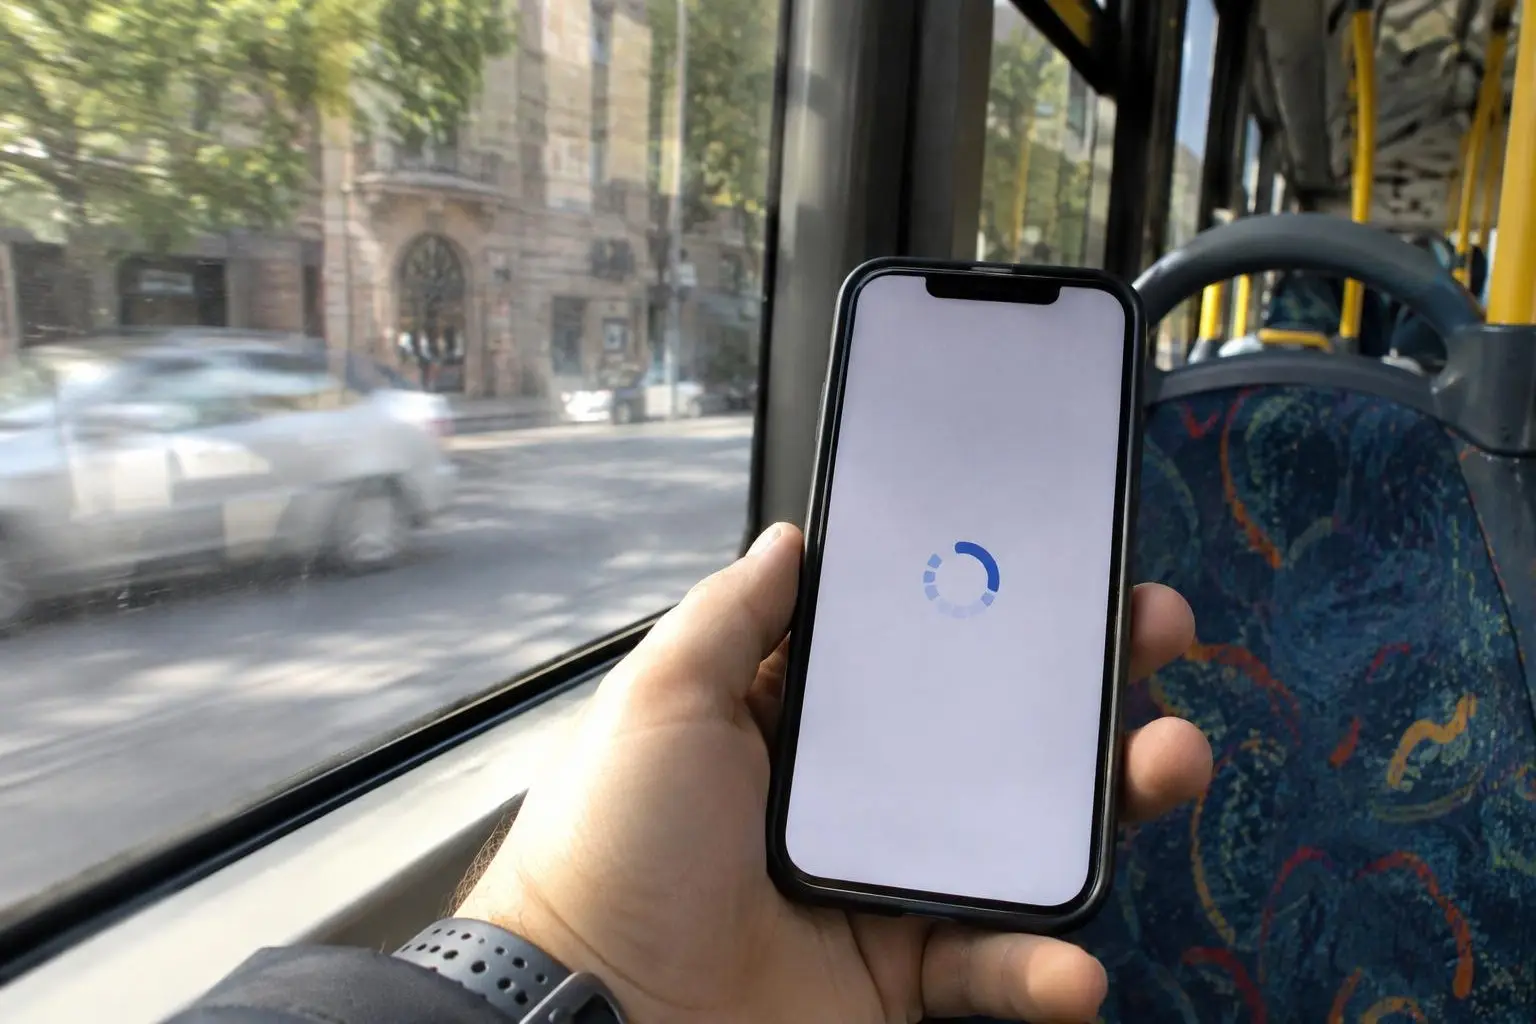
The website of a client who came to us for an audit was slow because of page weight and server settings, not because of connection speed or distance to the server. In a mobile lab test, the main content block on the homepage took 3.23 seconds to appear. After the fixes of October 30, 2026, it takes 2.25. Under 2.5 seconds counts as good, and we reached that without changing servers.
The main metric is LCP: the time until the largest content block on the screen appears, usually a heading or an image. According to web.dev, 2.5 seconds or less is good, and over 4.0 seconds is poor. It’s measured at the 75th percentile of real visits, separately for mobile and desktop: three out of four visitors must be within the target.
Fast. According to DataReportal’s late-2025 figures, based on Ookla tests, the median mobile internet speed in Armenia is 66.66 Mbps and fixed broadband is 71.20 Mbps. As of October 2025, the country had 2.36 million internet users, 80% of the population.
The lab tests used to measure page speed are much harsher. By default, Lighthouse’s mobile profile simulates a 1.6 Mbps connection with 150 ms latency and a CPU slowed down 4x. That’s roughly forty times slower than the median mobile connection in Armenia. So lab numbers show where a page is heavy, not how long a real client in Yerevan waits. The client’s site has no real-user data: there isn’t enough traffic for Google to collect it.
We ran the benchmarks on October 30, 2026, from a computer in Yerevan with Lighthouse 12.8.2, three runs per page; the table shows medians. Mobile profile, simulated throttling.
| Page | LCP before | LCP after | FCP before | FCP after | Size before | Size after |
|---|---|---|---|---|---|---|
| Homepage | 3.23 s | 2.25 s | 2.26 s | 1.65 s | 320 KB | 265 KB |
| Service page | 2.72 s | 2.12 s | 2.25 s | 1.65 s | 236 KB | 208 KB |
FCP is First Contentful Paint, the time until the first element appears. The Lighthouse score went from 91 to 98 on the homepage and from 94 to 98 on the service page. On desktop, the homepage used to open in 0.70 seconds; now it takes 0.50.
There’s also an unflattering result. I repeated the homepage test with real browser throttling instead of simulated throttling: LCP went from 2.96 to 2.66 seconds, so the gain is smaller, while Total Blocking Time (TBT) barely changed, 212 ms before and 218 ms after. Simulated numbers look better than real ones, and you should know that.
Before the changes, the client’s server delivered the site over HTTP/1.1, compressed files at gzip level 1, and set no cache headers for scripts or fonts. What changed:
Homepage weight dropped by 55 KB, and LCP improved by 0.98 seconds.
No. According to Lighthouse, the server’s response time on the homepage was 9–10 ms, and the server is in Yerevan. Today I measured it again: 15 ms from the start of the request to the first byte, including the secure TLS handshake. How server distance affects speed is covered in our article on hosting in Armenia and abroad.
For the client’s site, it was the font. Armenian letters need their own set of glyphs, so we split fonts by alphabet: the browser downloads a file only if the page actually uses those letters. On the homepage at a viewport width of 1280 pixels, the browser used to fetch 12 font files totaling 292 KB; now it fetches 4 files totaling 84 KB. That test is from October 2, 2026, and the full breakdown is in our article on Armenian web fonts.
Open PageSpeed Insights, paste your URL, and look at the mobile report. It shows two kinds of data. Real-user data comes from the Chrome UX Report for the previous 28 days. If there isn’t enough data for that page, it falls back to site-wide numbers, and if those are missing too, you won’t see real-user data at all, as with the client’s site. Lighthouse lab data shows the causes: it helps you spot oversized images and unnecessary scripts or fonts. Look at three things: LCP, page weight, and the number of requests. If LCP is over 4 seconds, web.dev rates it as poor.
Anyone with an image editor can resize and compress pictures before uploading them. Server configuration (protocol, compression, cache headers) needs server access, and a mistake there hits every visitor at once. Speed is part of my website maintenance service: I check it when I take a site on and then regularly, looking at images, unnecessary scripts, and hosting settings. I have a business interest in this work, but if your mobile LCP is already under 2.5 seconds, don’t overpay.
Your site stays online and up to date while you work: monitoring, backups, updates and changes are on us.
Search Which language to show on a 404 page, where to send visitors, and how real 404s differ from soft 404s. Our robot page and the Not found (404) report.
 Search
How to replace a website in Armenia without losing Google traffic: three-language URL maps, 301 redirects, and bank notices using our 27 URLs as an example.
 Search
One domain property or three URL prefixes, where to place hreflang for Google and Yandex, and what to check after adding a three-language website.
Talk to us
Phone us, write to us or send a short brief. You get a clear next step and, after the first conversation, a written estimate.
Animation is off because your system asks for reduced motion.